Beyond the Chase Card: A Framework for Modern Pokémon Set Economics
Modern Pokémon set performance is about more than the top chase card. A set is a self-contained market structure with overlapping layers that interact with each other.


“There is nothing so deceptive as an obvious fact.”
— Sherlock Holmes (Arthur Conan Doyle, The Boscombe Valley Mystery)
Anyone who spends time in and around the Pokémon TCG collecting hobby understands that the value of a Pokémon set is concentrated. A small number of cards drive most of the discussion, transaction volume, and value. But that obvious fact can obscure the more useful question if we stop there.
The more useful question is not whether a set is concentrated, but what kind of concentration it develops.
Some concentration is healthy. Concentration can anchor a set, focus collector attention, support sealed-product demand, and create durable identity. Other concentration is fragile. It can reduce a set to a lottery ticket, crowd liquidity into just one or two cards, and leave the rest of the checklist economically irrelevant once the initial release hype fades.
A Pokémon set is not a single economic unit. It is a market structure made up of overlapping layers. These layers unfold over time at different speeds and interact with each other. These interactions provide the contours of the set-level ecosystem.
The Core Framework: Chase Gravity, Chase Clusters, and Market Depth
Chase gravity is the pull that a set’s leading cards exert on attention, liquidity, value, and collector narrative. High chase gravity is not inherently bad. A strong top card or group of cards can anchor a set and give it identity. The risk is narrow gravity: when the set’s relevance depends almost entirely on one card or a very small group of cards, leaving little meaningful activity elsewhere.
The chase cluster is the group of cards creating that gravity. It is the set’s high-interest core. Relic Passage Research does not define this cluster mechanically as the top five or ten cards by raw price. Instead, the cluster is identified using a blend of different market signals.
This distinction matters because two sets can both have high chase gravity while having very different structures: one may be a single-card gravity well, while another may have a broad, durable chase cluster.
Chase gravity tells us how strong the pull is; the chase cluster tells us what is doing the pulling.
Market depth refers to how much meaningful market activity exists beyond a single card. Critically, that depth does not have to be located outside the chase cluster.
In some sets, depth exists within the cluster itself because several leading cards maintain value, liquidity, graded demand, and collector attention. This can be referred to as cluster depth.
In other sets, depth appears outside the chase cluster because a secondary layer of cards continues to generate transaction activity even if that activity does not carry most of the dollar value of the set. This can be referred to as residual depth.
The existence of both cluster and residual depth is why chase gravity and market depth are related but not true opposites. A set can have strong chase gravity and still have a vibrant economic ecosystem if the gravity is distributed across a well-formed cluster. A set can also have a compact chase cluster with meaningful activity beneath it.
The important question is not whether set value is concentrated. In modern sets, it is. The question is whether that concentration is supported by enough market depth, either inside or outside the chase cluster, to create a robust set-level market structure.
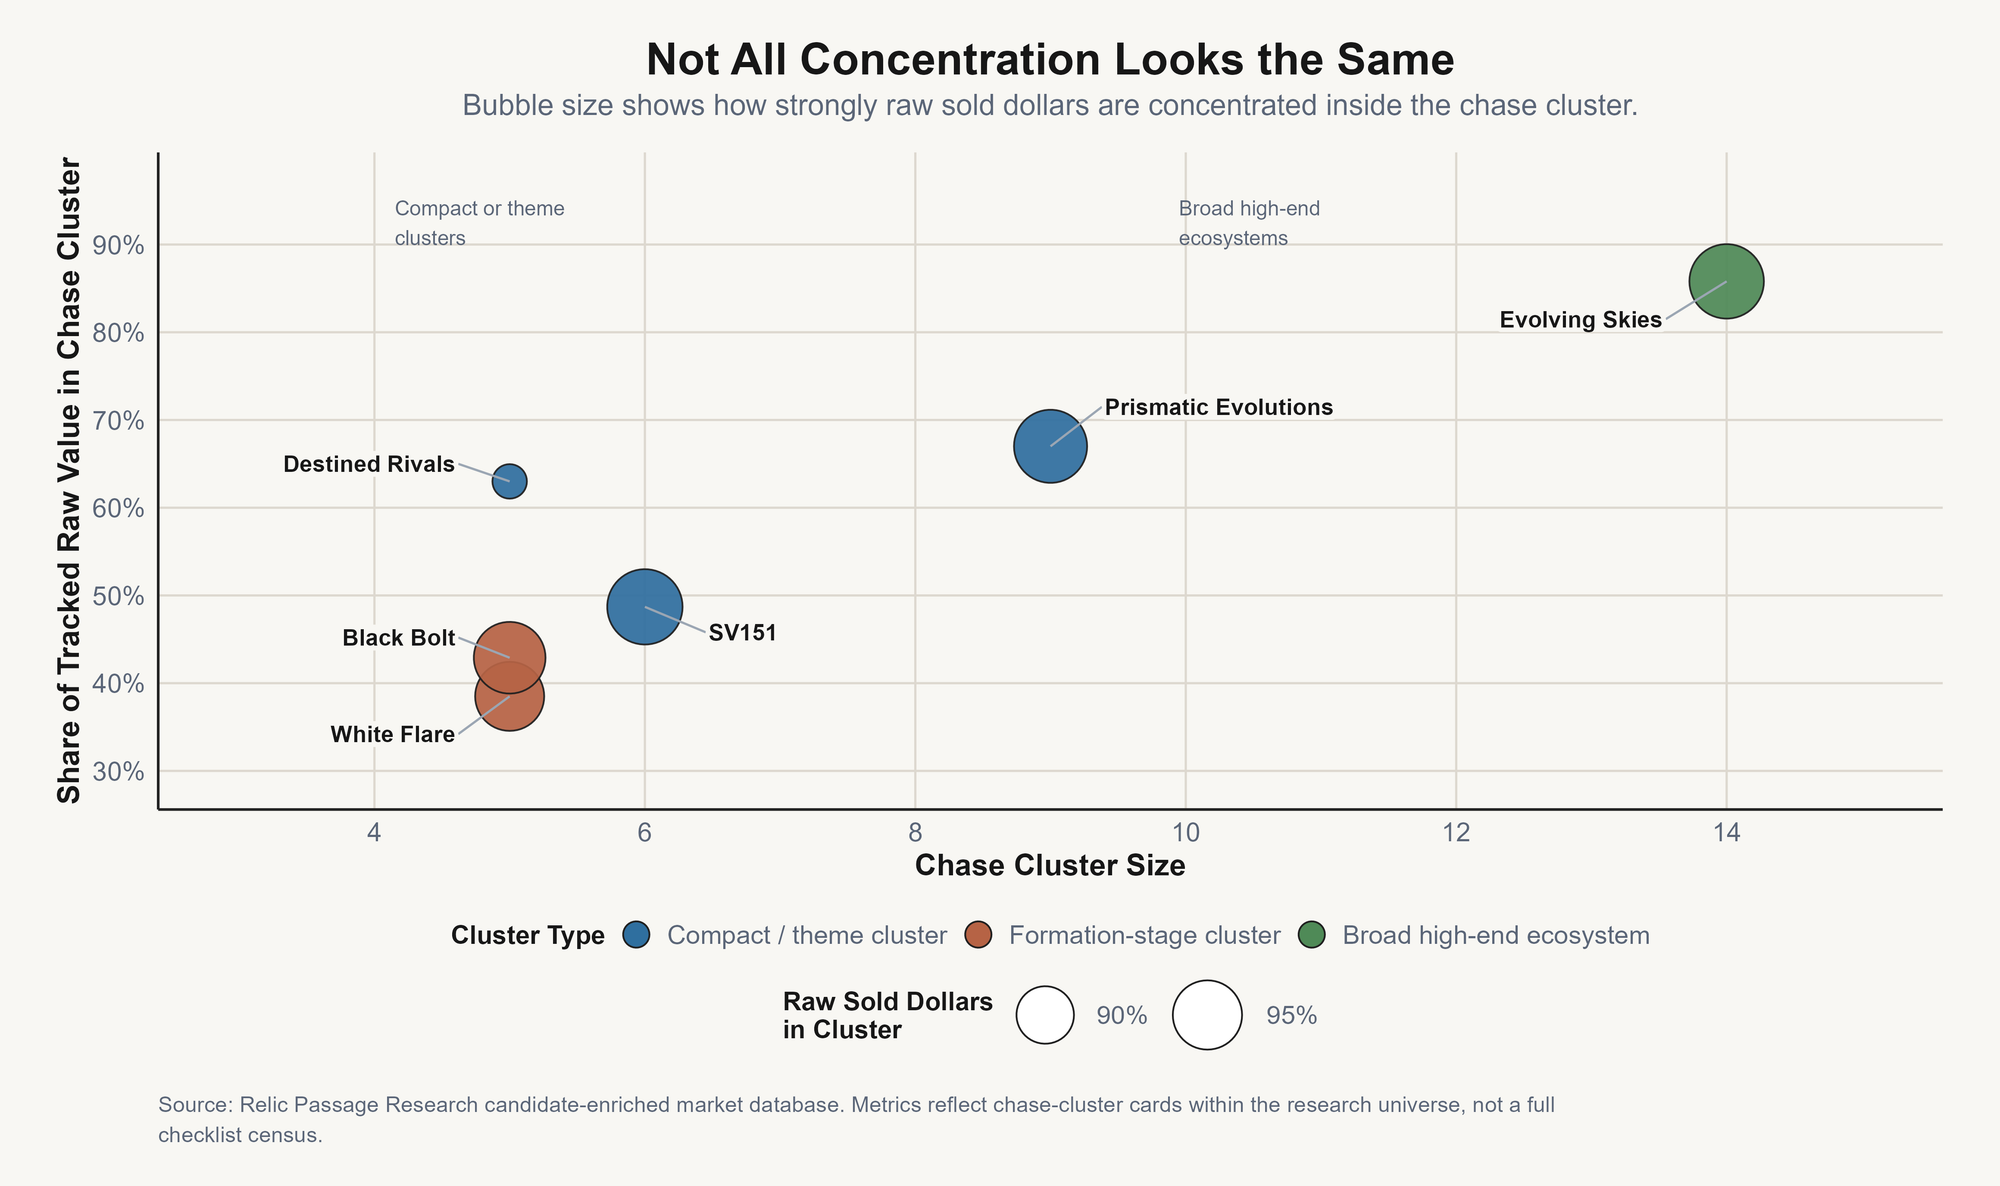
The distinction between chase gravity and chase cluster structure is easier to see visually. Different forms of set concentration create different market structures.
The Five Layers of Set-Level Market Structure
A central tension of a set’s market structure is the interaction between chase gravity, chase cluster composition, and market depth across five observable layers: raw pricing, sold liquidity, graded pricing, graded supply, and lifecycle stage.
Raw pricing: Shows where visible card-level value sits before the market is fully sorted. In the chase cluster framework, the key question is not simply how much value sits in the top five cards. It is how much of the set’s raw value is controlled by the chase cluster, and how much value remains outside it.
A compact cluster with a high raw-value share points to narrow raw concentration. A larger cluster with a high raw-value share may point to a broad high-end ecosystem. A lower cluster raw-value share can suggest broader raw pricing, but that breadth still needs to be tested against actual sold activity.
Sold liquidity: Shows which cards are actually converting into buyer demand. This layer should be separated into sold-dollar share and sold-count share, and into raw and PSA 10 sold activity. Sold-dollar share shows where transaction value is clustering. Sold-count share shows where buyer participation is occurring.
A chase cluster can dominate dollars while leaving meaningful transaction activity outside the cluster, which is different from a market where both dollars and transaction count are cluster-bound.
Graded pricing: Shows whether the chase cluster carries meaningful PSA 10 premiums, and whether those premiums are distributed across the cluster or isolated in only one or two cards.
Raw collector interest and PSA 10 economics are not the same thing. A set can have many raw cards that collectors like, while only a smaller group supports meaningful graded premiums. The PSA 10-to-raw multiple helps show how much premium the graded market is assigning to condition, authentication, scarcity, and collector confidence.
Graded supply: Shows where PSA 10 population risk is forming. Supply can concentrate just like demand. A high PSA 10 population inside the chase cluster is not automatically bad if demand is strong enough to absorb it, but it changes the risk profile.
Gem rate adds another important layer: a chase cluster with low gem rates can support stronger graded premiums, while a cluster with high gem rates may see PSA 10 supply form more quickly.
Lifecycle stage: Determines how the other layers should be interpreted. In a young set, raw prices may be broad while sold dollars are already clustering, or graded supply may still be too immature to draw firm conclusions.
In a mature set, raw value, sold liquidity, graded pricing, and population may converge around a durable chase cluster. The same metric value can mean different things depending on whether a set is in release formation, collector sorting, a grading wave, or long-term identity mode.
These layers do not always mature at the same speed. In newer sets, disagreement between layers often reflects market formation: raw prices, buyer behavior, graded premiums, and population data have not fully caught up with one another.
In mature sets, the layers may converge around the cards that have become the set’s durable identity. Both patterns matter. Disagreement shows where the market is still sorting. Convergence shows where the market has already made up its mind.
What the Framework Shows Across Six Sets
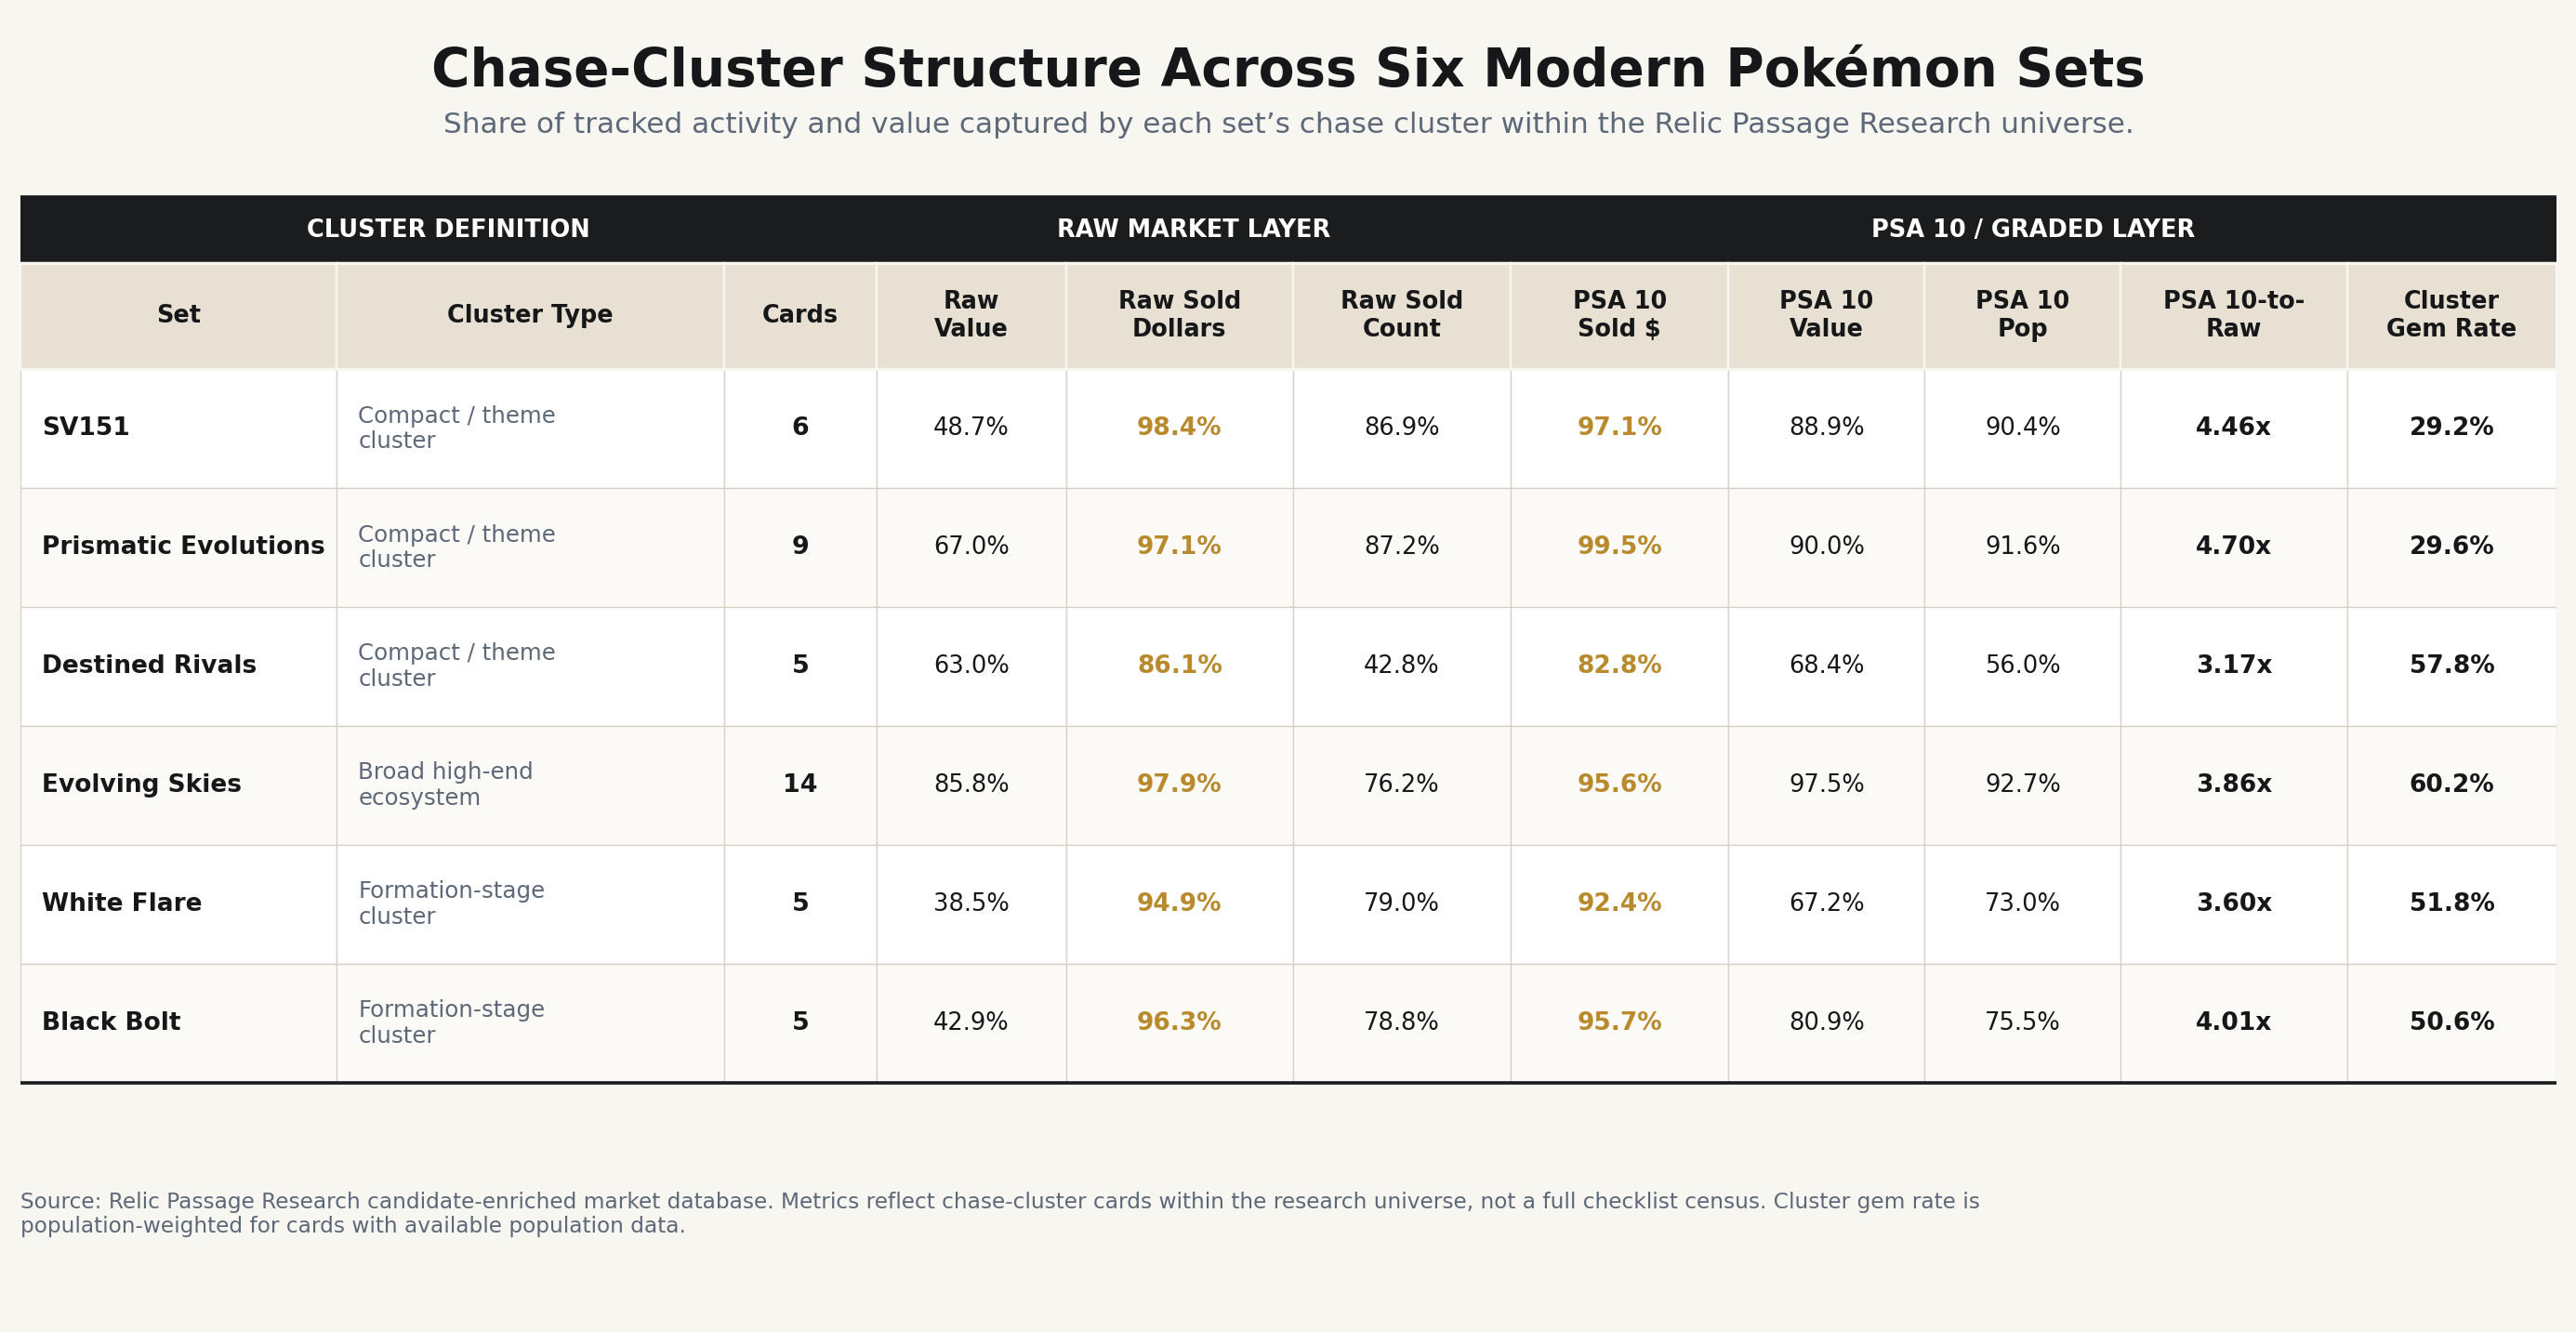
The table below applies the framework to six sets that illustrate different concentration structures. The table is not meant to rank sets. It is meant to show how different concentration structures behave across market layers.
Four Questions for Reading the Table
How large is the chase cluster?
Cluster size tells us how many cards lead the set. Cluster raw value share tells us how much of the set’s raw value those leaders control. The relationship between the two tells us whether concentration is narrow, broad, or structurally dominant.
A set can be highly concentrated because it has a very small chase cluster. A set can also be highly concentrated because a large chase cluster absorbs most of its economic value. This separates compact clusters from broader theme-based clusters and high-end ecosystems.
A 5-card chase cluster and a 14-card chase cluster can both lead a concentrated set, but cluster size tells us what kind of concentration the set has.
How much raw value does the chase cluster control?
This shows where the value sits before considering liquidity. A high cluster raw-value share means the set’s visible raw-card value is concentrated inside the chase cluster. This metric can be misleading if read on its own.
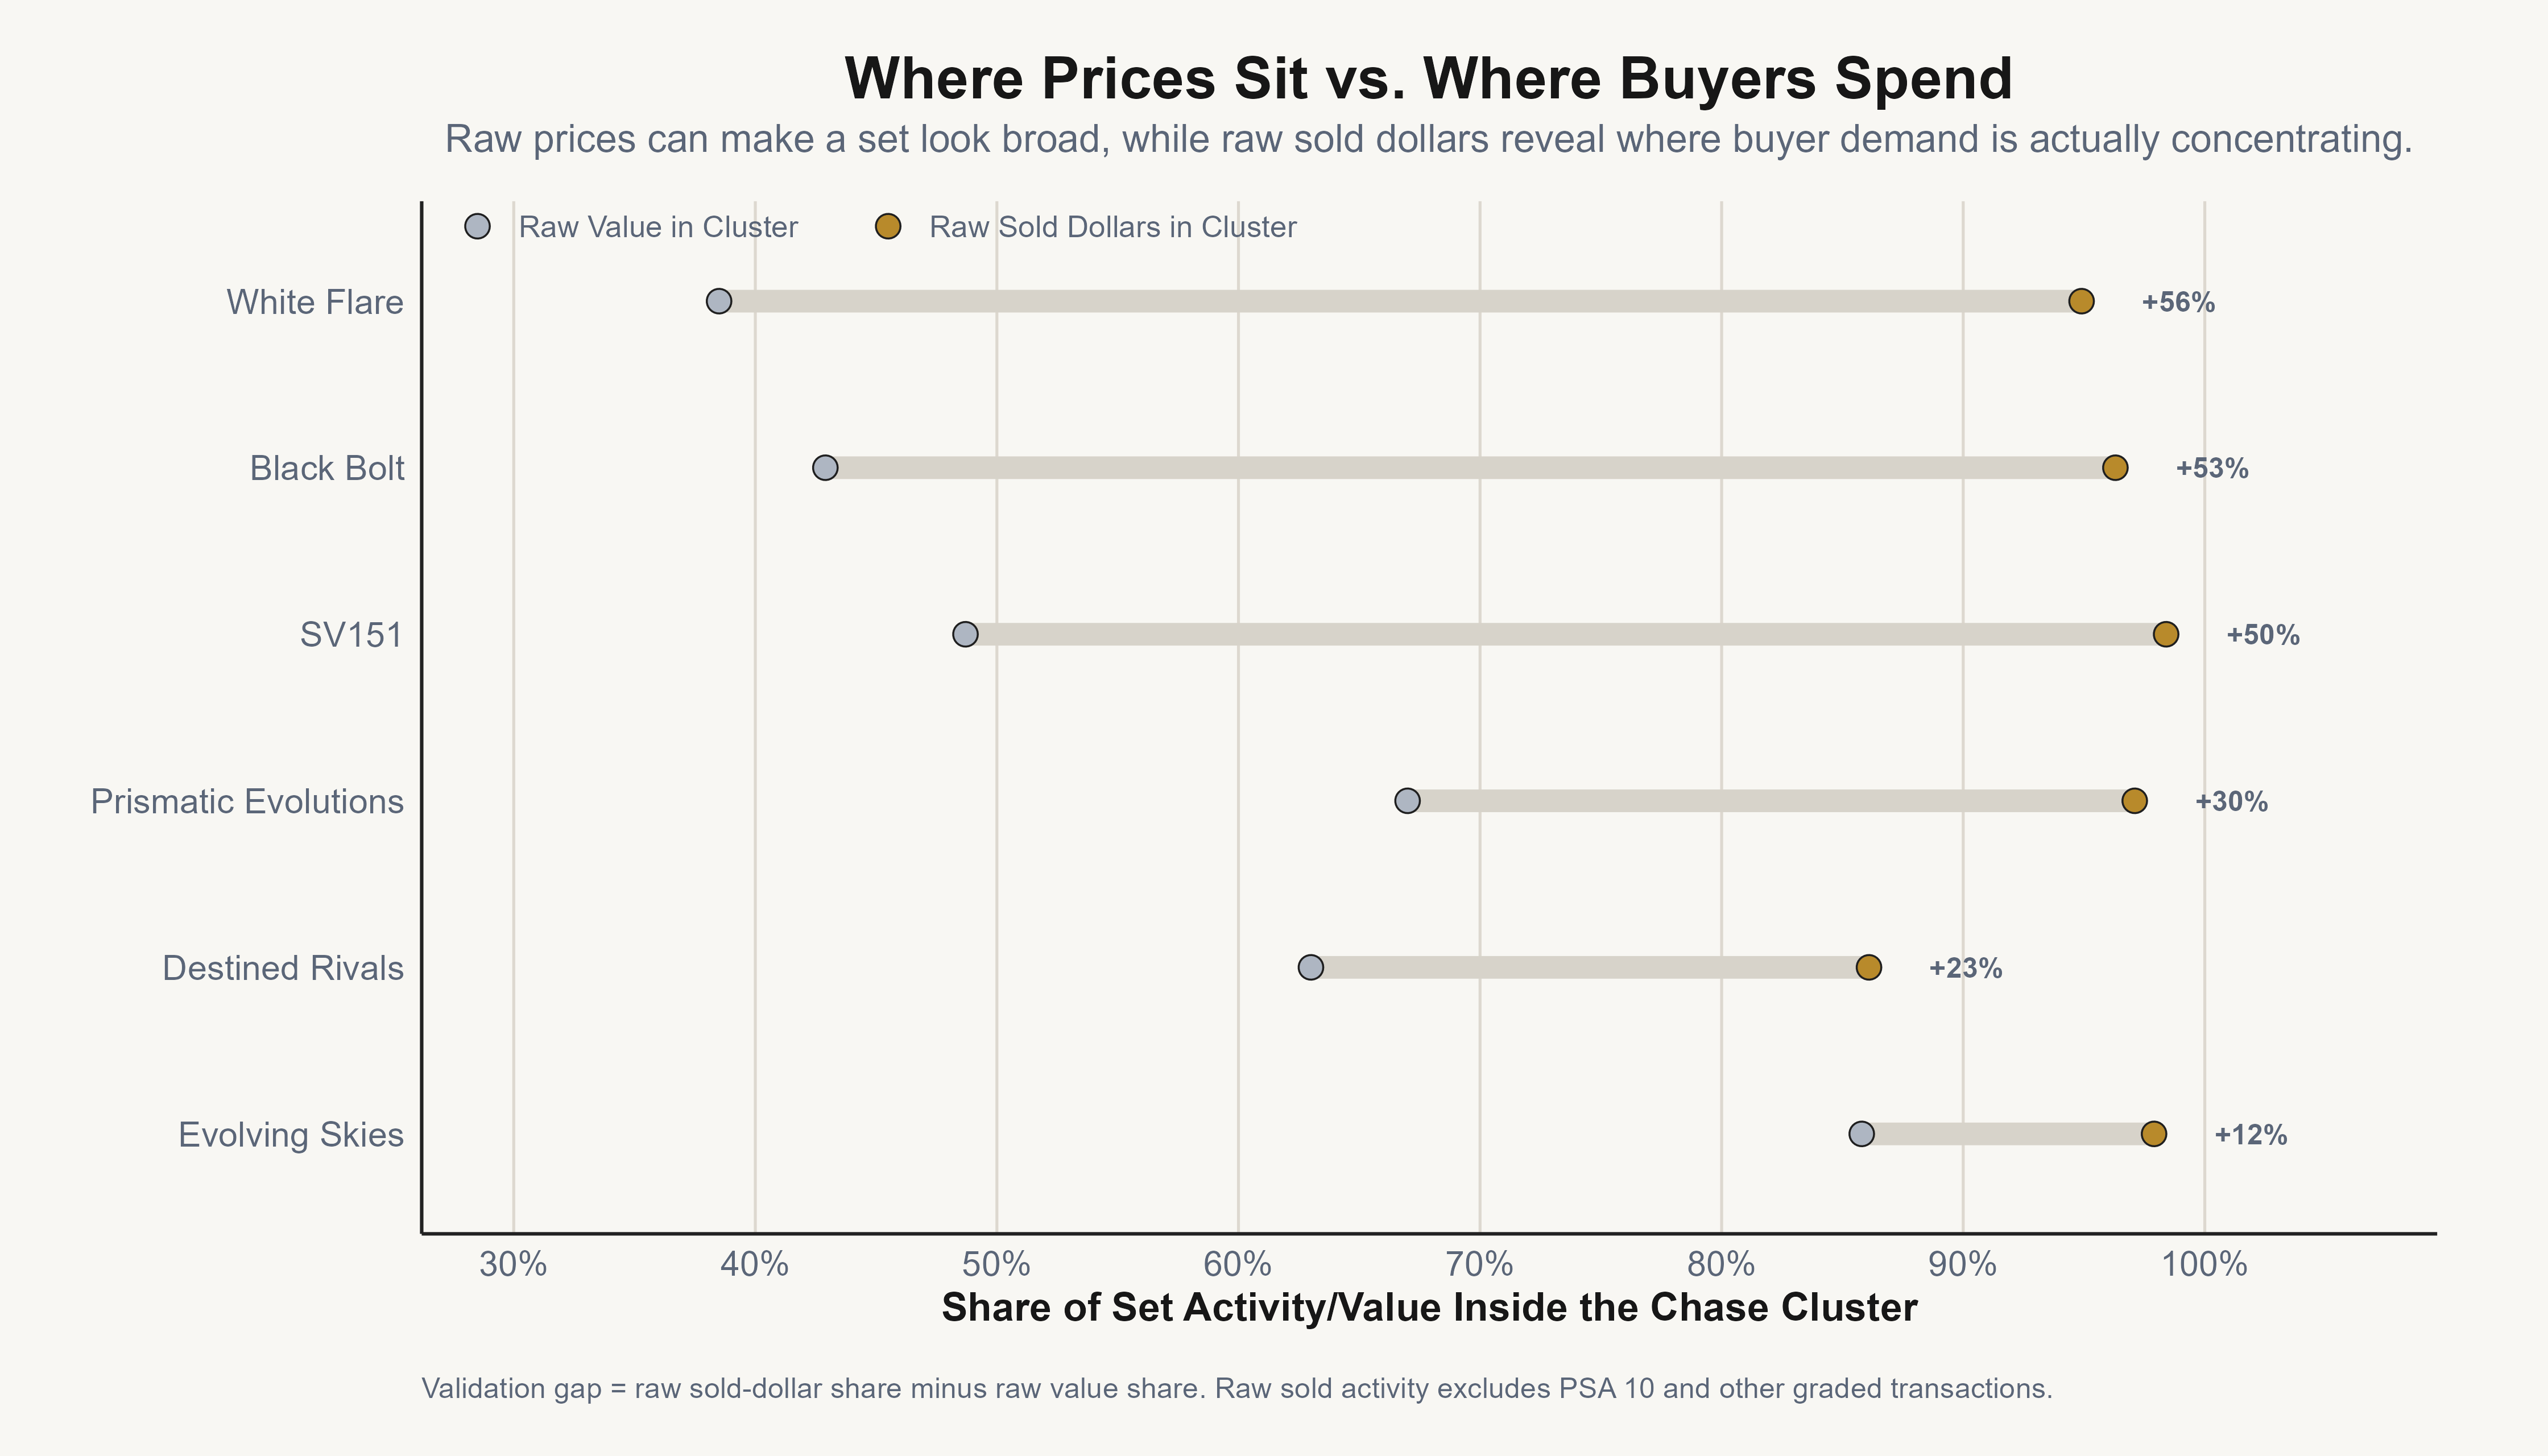
Is the raw value confirmed by sold activity?
Raw prices show where value appears to be. Sold dollars and sold count show where buyers are actually acting. A large gap between raw-value share and sold-dollar share can reveal where apparent breadth is not converting into transaction-confirmed demand.
Young or still-forming sets can look broad in raw value, but actual transaction dollars may already be concentrated in the chase cluster. As sets mature, raw value and sold value may become more aligned.
The gap between sold dollars and sold count shows whether the cluster is generating broad transaction activity or whether a few expensive cards are absorbing most of the dollars.
A cluster can be economically dominant without being the whole transaction ecosystem. Destined Rivals is the clearest example: the chase cluster controls most raw dollars, but less than half of raw transactions.
Does the graded layer reinforce or complicate the raw story?
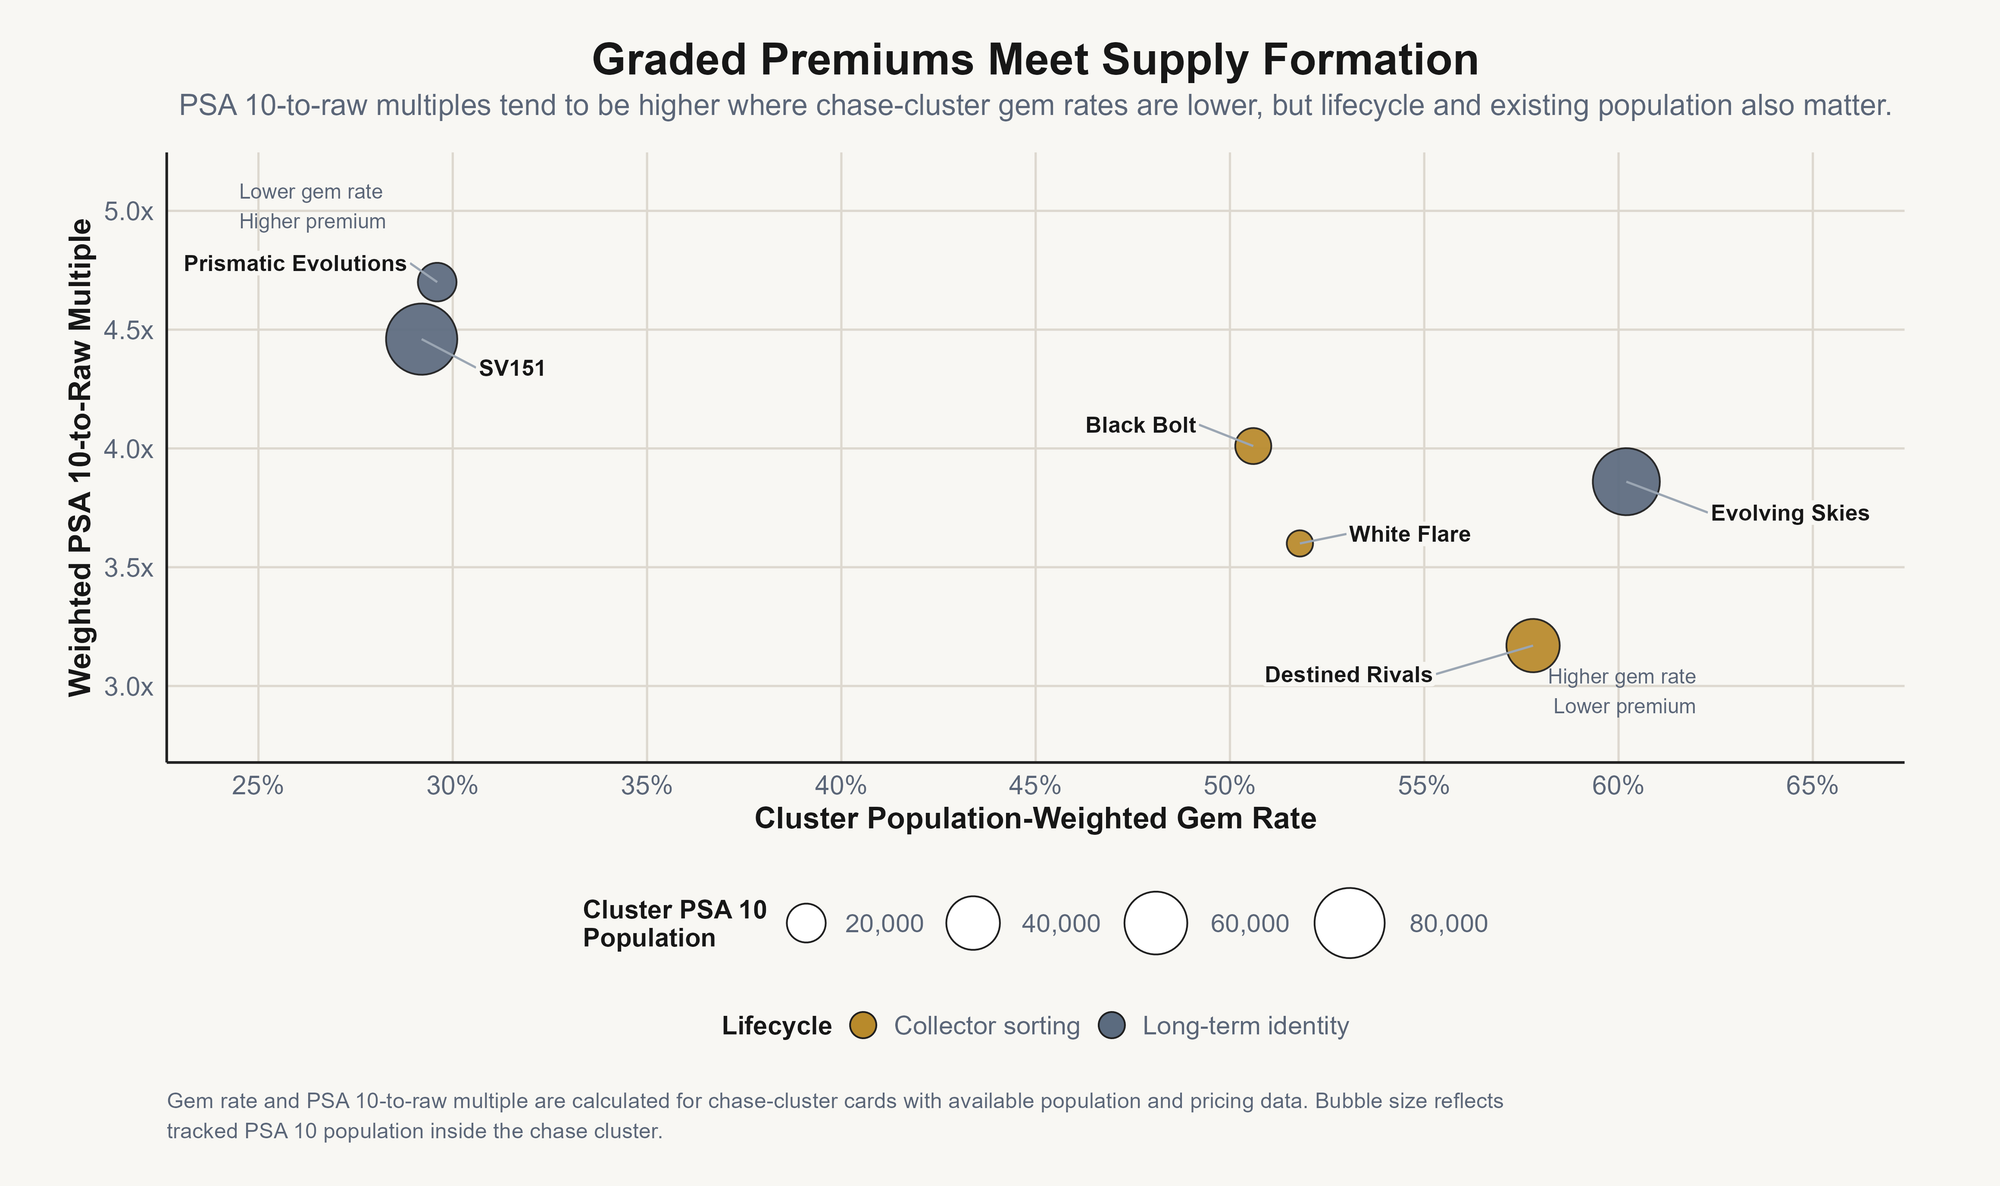
PSA 10 sold activity, PSA 10 value, population share, PSA 10-to-raw multiples, and gem rates show whether the graded market is confirming the chase cluster, narrowing it, or introducing supply pressure.
The PSA 10-to-raw multiple generally moves in the direction the gem-rate profile would suggest. Lower gem rates appear to support higher graded premiums in SV151 and Prismatic, while higher gem rates in Destined Rivals and Evolving Skies suggest PSA 10 supply can form more readily.
Other factors also matter. Evolving Skies may have lower multiples because raw prices already reflect the set’s established prestige. SV151 has a lower multiple than Prismatic Evolutions partially due to the massive graded population relative to other sets.
What the Table Reveals
First, concentration is not one thing. SV151, Destined Rivals, White Flare, and Black Bolt are led by compact 5- or 6-card clusters. Prismatic Evolutions is led by a larger but theme-correlated Eeveelution cluster. Evolving Skies is different again. Its 14-card cluster functions more like a mature high-end ecosystem than a narrow chase tier. Those are not interchangeable structures. A set can be concentrated because it is fragile and narrow, or because its high-end identity has become broad enough to define the set.
Second, raw value is not the same as market-confirmed demand. White Flare and Black Bolt look relatively broad by raw value, with their chase clusters accounting for 39% and 43% of tracked raw value. But those same clusters account for 95% and 96% of raw sold dollars. That gap is important to note. It shows how a set can appear broad on a price sheet while actual buyer dollars are already clustering around a much smaller group of cards.
Third, maturity shows up when the layers start to align. Destined Rivals is interesting because its raw dollars are concentrated, but its raw sold count is much more distributed. That suggests a market still sorting itself. Evolving Skies shows the other side of the lifecycle: raw value, raw sold dollars, PSA 10 sold dollars, PSA 10 value, and PSA 10 population all point toward the same broad high-end cluster.
In a young set, disagreement between layers can be part of market formation. In a mature set, convergence can signal that the market has settled on the cards that define the set.
Why This Matters
The practical value of set-level analysis is not that it tells every collector or investor what to buy. It is that it helps define the market environment around whatever strategy they are already pursuing.
A master set collector, a sealed-product holder, a raw-to-grade operator, and a graded-card flipper may all look at the same set differently. But each is still exposed to the same underlying structure: how powerful the chase cluster is, how much activity exists beyond it, whether raw prices are being confirmed by sold liquidity, whether PSA 10 premiums are supported by supply conditions, and whether the set is still forming or has already settled into a durable identity.
The goal is not to reduce the hobby to a spreadsheet. It is to use a more structured approach to ask better questions. Modern Pokémon sets are rarely broad in a simple, equal-weighted way. They form around chase clusters, secondary demand, graded-market constraints, and lifecycle shifts.
Understanding those dynamics does not replace taste, collecting goals, or card-level analysis. It makes each of them sharper. The top chase card may start the conversation, but the structure around that card is where the market actually forms.
Methodology Notes
Relic Passage Research uses a public-safe summary layer derived from a broader Pokémon market database. The database combines third-party Pokémon market data, including PokémonPriceTracker where available, with Relic Passage enrichment for sold activity, graded pricing, population visibility, lifecycle classification, and set-level market structure.
Source availability, field coverage, and update frequency vary by table and set, so the metrics should be read as structured market indicators rather than exhaustive market totals.
The analysis in this article is based on a candidate-enriched research universe, not a full checklist census. Relic Passage tracks a broad raw-card universe, then applies deeper enrichment to cards most likely to carry market signal.
Chase clusters are identified using a blend of multiple market signals rather than a simple top five ranking. This approach is designed to identify the cards that actually lead a set’s high-interest market identity.
Sold activity is separated into raw, PSA 10, and other graded transactions because graded cards can dominate blended dollar volume. Raw sold-count share helps show buyer participation, while PSA 10 sold-dollar share shows where graded transaction value concentrates.
Population and gem-rate metrics should be read as supply-structure indicators, not deterministic price forecasts. A low gem rate can support PSA 10 premiums, but graded prices also depend on demand, existing population, liquidity, and lifecycle stage.